
Diving in the Mayor’s proposed FY23 budget
Nashville’s annual operating budget process has started. The Metro Council received a copy of the Mayor’s proposed FY23 operating budget ordinance on April 29, 2022, and we are required to pass a budget into law no later than June 30, 2022. We have some resources available to us, but the “budget book” from the Finance Department isn’t scheduled to be out until May 13.
I spent some time today looking over the proposed budget. I’ll share links to what I’m looking at and some early observations.
Here are the resources I’m using (in the order of how useful they are for me):
The Finance Director’s budget presentation (April 29, 2022);
The Mayor’s Office budget presentation (April 29, 2022); and
Most of my observations will be about changes in dollar amounts being spent from one year to the next. Until we see the budget book in a few weeks, it will be impossible to determine whether particular new spending is the result of new programs, new personnel, inflation, moving functions around the government, or some combination of these factors.
In total, the proposed FY23 budget is $319.6 million larger than the FY22 budget. This new spending breaks down like this:
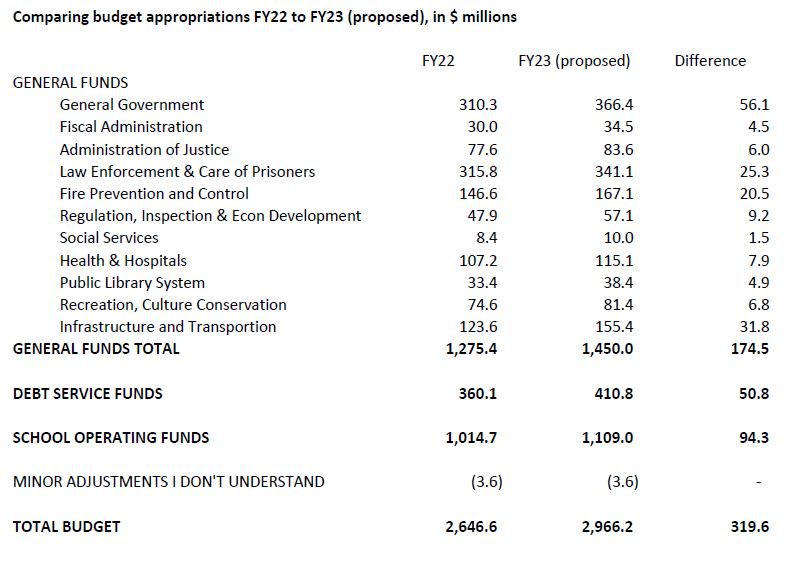
I’ll spend most of this post talking about the “General Funds” category. But let me first quickly hit the other two I have highlighted.
The Mayor’s FY23 budget shows an increase for “School Operating Funds” of $94.3 million. His press release a few days ago said the increase was $91.2 million. I can’t tell you why the ordinance is a bit different. As the budget process unfolds each year, Council members rely on MNPS to tell us exactly what they’ll do with the new appropriations. I don’t have that available today.
There is a $50.8 million increase for “Debt Service Funds.” I may address details about this in another post. In summary, the Finance Director told the Council on April 29 that the administration had been planning on the next large general obligation bond issuance in FY24. They want to pull that forward to FY23 in an attempt to get ahead of expected interest rate increases. That also would have the effect of clearing out the city’s commercial paper line of credit (which is like a short term credit card for large capital expenses) in advance of the non-stadium infrastructure work the Mayor would like to do on the East Bank. More on that another time.
Under “General Funds” in my chart, there are multiple categories that track along with the categories in the formal budget ordinance. I’ll give you more details on many of these categories.
In the General Government category, there are several new expenses compared to last year’s budget. I’ll have to ask Finance to explain these items. They are on pages 15-16 of the Mayor’s budget ordinance:
Property Loss, $9,744,600
Police Recruitment Bonus, $1,000,000
Technology Review & Improvements, $1,000,000
Master Space Planning, $1,500,000
For other major categories of expenses, I will include charts showing the main differences between the current fiscal year budget and the proposed FY23 budget. I am excluding most line items where there is no substantial change. So if you think something is missing from my charts, it probably means there is no notable change.
Next here are the major departments within General Government and Fiscal Administration:
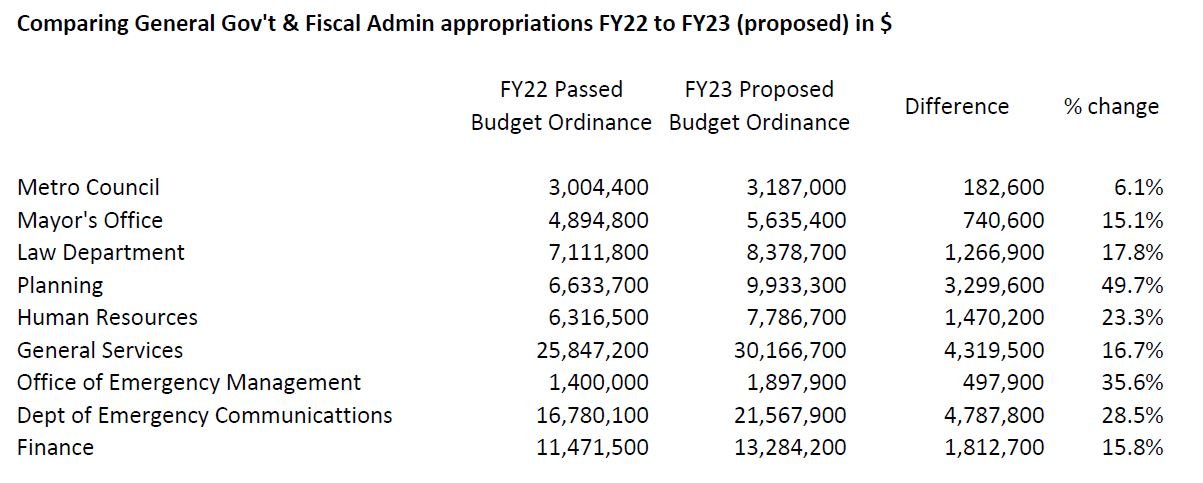
Many of these departments jump off the page. For the Law Department, I don’t know, but I’m guessing that its large increase is due to the cost of outside law firms on large deals. We don’t know what the increase in the Mayor’s Office budget will buy. I think my colleagues will have lots of questions about the “why” behind many of these changes.
The next list is for law enforcement and the administration of justice. Among these, the police department and the sheriff’s office always get a lot of attention:

Then, for transportation and NDOT, you’ll see a massive increase for NDOT. As a reminder, NDOT is basically the former Public Works department minus trash pick-up, which was moved. The increase for WeGo was expected because last year they were able to rely on federal relief dollars to some degree.

This next one is the rest of the items I found interesting. There is a lot here to go through. There are more new spending items with which I am not familiar yet. This shows the Chamber of Commerce still in the budget for $175,000. It shows increases for the Barnes Fund, Nashville General Hospital, and the Metro Health Department and more.

My last chart relates to Fund Balance, which can be considered a sort of savings or reserve fund. I have written about this over the years. In FY19 and FY20, when the city foolishly was refusing to adjust its property tax rate, it was burning through Fund Balance at an alarming rate. As a result, Nashville entered COVID with the worst Fund Balance of the top 25 cities in America. As expected, the property tax rate increase in 2020 has helped move the city from having a horrible Fund Balance to a semi-decent one.
I’ll probably write a separate post about this at some point, but comparing the FY22 budget to the proposed FY23 gives us an indication of the status of the city’s Fund Balance. Here’s some information comparing the estimated Fund Balance as of June 30, 2022, in the two budget ordinances.

These amounts are big numbers. But they still are materially behind what the average Fund Balance was for the 25 largest cities in America prior to COVID. The city would need to build up another few hundred million of additional Fund Balance to be adhering to best practices for government finance.
That’s it for now. As we go through the Metro operating budget process, I will post more information.